
A Trade Structure With An Informational Edge
A Lesson in the Dark Arts

It’s Not Nothing, But It’s Not Something, Either
Most options flow is noise - someone buying 2k calls or whatever. Nothing there.
Right Before Close someone bought 10,000+ $OPEN 5c 08/22 at 0.20
$RDDT into minor dip sees a large buyer of 650 June $350 calls at $30.65, seeing plenty more upside
Neither trade tells you anything about a corporate event. Just regular flow. These are just some of the many listed options trades/trade structures that go up in a given trading session and could represent a speculative gamble, someone expressing a view on volatility or perhaps adjusting their reward versus risk profile of their position—or even an over-the-counter trade (OTC) getting printed as a listed option in the open interest.
What are Dark Arts?
When companies are about to get bought or good things are afoot, weird stuff starts happening. Governance gets cleaned up. Equity grants get adjusted and in some cases spring loaded. Comp committees rewrite severance packages. A director with M&A history joins the board. Executive chair becomes "interim" CEO.
None of it proves anything. But my antenna goes up when I see these 'Dark Arts' datapoints show up in company filings.
Dark arts are about signals, pattern recognition, incentive structures, off-cycle changes, governance mapping, etc. Here are some examples of dark arts: Special equity awards re spring loaded options, changes in governance (removing dual class and special voting arrangements), the fine print in a change of control severance plan, the details and interpretation of executive / key member employment agreement, onboarding directors with a history of strategic alternatives, board member or executive chair joins as interim CEO during a succession path leading to M&A speculation. These things tell us that the board of directors is active and thinking through their business plan and even strategic alternatives; we may cover some of these in greater detail in future posts.
What Are Not Dark Arts that People Play Up as Dark Arts?
Many datapoints are useful information that help build conviction for an event-driven trade path to an eventual resolution, but that is all they are - datapoints. 8k Filings with Change of Control agreements in isolation. Option grants strike prices for executives and board members indicating high share upside potential. Insider buying and selling or even options purchases.
A Filthy Trade Embedded with a Potential Informational Advantage
Trading has its own dark arts. Every day, options alerts scream about "monster" prints—5k calls here, 10k puts there, risk reversal trades, etc. Most of this activity is noise, though someone invariably has a product or subscription to sell you based on it...The reality is generally far more mundane: dealers hedging their own book or perhaps convert arb desks delta hedging. It’s easy to retroactively craft a compelling explanation for why those prints were ‘smart money’ once the stock has moved and news has hit, but from my perch it's usually just noise.
Sometimes though, someone places a trade structure that only makes sense if they know something or they think they know something. I try and pay attention to these 'filthy' options prints.
What to look for
Wide calendar spreads. Buy near-dated calls slightly out of the money. Sell much longer-dated calls way out of the money. Put it on for small debit, even money, or even a credit.
Front leg = long gamma. You want a move soon. Back leg = short vega. You don't really believe that this stock finds blue sky two years out.
Net/net: You're timing an event and happen to be capping your upside. Otherwise, you're making a foolish vol bet.
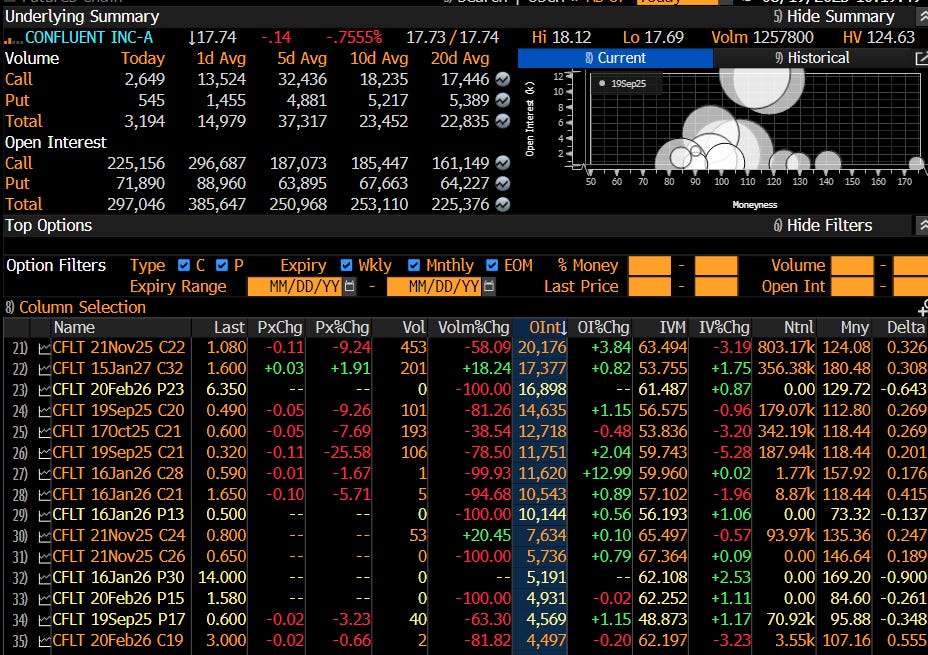
The $CFLT print
Here's what caught my eye on Confluent:
Trader Bought 17k November $22 calls for around ~$1.55, and Sold January 2027 $32 calls around $2.20, size 15-17k
Net credit about 65 cents per spread.
Front leg: short dated, 5-10% OTM, long gamma Back leg: way out, 20-30% OTM, short vega
Vol curve: Front month low 60s, back end mid-50s. Think about it - you're selling 2027 calls that are trading at LOWER implied vol than the front month. That's insane unless you know those long-dated calls are going to zero when the deal gets announced.
Delta: Front delta around mid-30s, back around 30-32.
Directional bet and a specific embedded bet on the timing.
What it means
Someone thinks this company is likely to be acquired and they think it is going to be soon. And they think they know roughly what price...
You don't sell Jan '27 $32s in size if you think this becomes a $45 standalone. You would more likely sell those calls because you know a cash bid (could be mainly cash and some stock too) comes before November, under that strike, and kills all the long-dated uncertainty and options premium (keep in mind the long dated vol is LOWER than the near dated vol).
The math
"But what if the deal is $34?"
Run it per spread. They collected 65 cents up front.
Deal at $28 before November: Nov $22 worth ~$6, Jan '27 $32 goes to zero. P&L = $6 + $0.65 = $6.65 per spread. On 17k spreads, that's $11.3 million.
Deal at $34 before November: Nov $22 worth ~$12, Jan '27 $32 has $2 intrinsic plus some time value. Call it $2. P&L = $12 - $2 + $0.65 = $10.65 per spread. About $18.1 million on 17k.
Price caps help this trade as long as they hit before November. Mid-20s to low-30s works fine. Anything above $32 is a nice payday.
Where it breaks
This pays on timing plus back-end vol collapse. It bleeds when time passes and the back gets expensive.
No deal by November: Front decays to zero. Long-dated calls get repriced higher because people start dreaming about 2026 outcomes. Jan '27 $32 goes from $2.20 to $3.00 while your front goes to zero. You're looking at -$2.35 per spread, or -$4 million on 17k.
Slow grind up: Stock drifts to $25 by November, no announcement. Front call worth $3, but you didn't get the gap. Meanwhile long-dated vol inflates on "what if $40 in '26" stories. Back call trades up to $2.80. P&L maybe 85 cents per spread. Push.
Rumor cycles: Chatter about higher prices, no timing. Front IV spikes then bleeds as rumors miss expiry. Long-dated $32s stay bid on tail risk. Probably do ok.
Vol shock: Messy guidance, regulatory noise, risk-off. Front doesn't move much, back rips on everything getting repriced. Short vega hurts where you sold it.
All standard risks of selling uncertainty two years out without getting near-term certainty. The point is that the trader knows all of this and put the trade structure on anyway.
Obviously we don't see their full book. Maybe they're hedging a huge long position, or this is part of some bigger structure.
This isn't some retail trader getting cute with calendar spreads. This is probably a fund with real ammo and a view on CFLT being acquired in the near future. The curve inversion, the credit structure, the sizing—this is someone who likely 'knows' the announcement period range and the offer price range.
Reading flow again
Unusual options aren't magic. A lot of it is just broker hedging, unwinds, OTC options hitting the listed tape. Look for: front long/back short, wide calendar, net credit, inverted vol, OTM cap. When that shows up in size, someone either has conviction or something better.
If there is no deal by November, curve may steepen, back vol rips—then either I am reading the tea leaves incorrectly, or someone with very expensive information just got very unlucky.